LinkedIn Ads Data Connector User Guide
LinkedIn Ads is a powerful platform for B2B marketing, lead generation, brand awareness campaigns, and revenue attribution. This guide will help you connect your LinkedIn Ads account to Power My Analytics, enabling you to create comprehensive reports and gain valuable insights into your advertising performance.
Prerequisites

Notice: As of July 30, 2025, the standalone LinkedIn Business Manager connector has been discontinued. Revenue Attribution Report (RAR) functionality has been consolidated into the LinkedIn Ads connector to provide a more unified and enhanced reporting experience. For more information, please see LinkedIn Business Manager July 30, 2025 Migration to LinkedIn Ads.
Before connecting LinkedIn Ads to Power My Analytics, ensure you have:
- A LinkedIn account with Viewer access to the ad account you want to connect
Grant Viewer Access to an Account
To grant Viewer access to an account:
- Go to your ad account and click Add people.
- Find the account you want to add and click Assign role.
- Select the Viewer role and click Add.
Adding LinkedIn Ads as a Data Source
- Navigate to your Power My Analytics Hub and select Sources from the menu.
- Click + Add new source and choose LinkedIn Ads from the gallery.
- Sign in to your LinkedIn account to authenticate.
Creating a Data Studio Report
Follow these steps to create a Data Studio report using your LinkedIn Ads data:
- After adding LinkedIn Ads as a data source in the PMA hub, navigate to Reports > Data Studio
- Select LinkedIn Ads under Create Data Studio Report (this will open the official Data Studio application in a new window)
- Google Data Studio Configuration:
- Step 1:
- Name your data source (e.g. "LinkedIn Ads - Organization Name")
- Choose your Power My Analytics hub from dropdown
- Optional: Leave "Use report template for new reports" checked to use PMA demo template
- Click Next
- Step 2:
- User Account: Select LinkedIn Ads account (real data) or "Sample Account" (sample data)
- Click Next
- Step 3:
- Choose "Accounts" for reports
- Optional: Allow "Accounts" modification in reports
- Click Connect (top right) to complete the data source configuration
- Step 4:
- Click Create Report (top right)
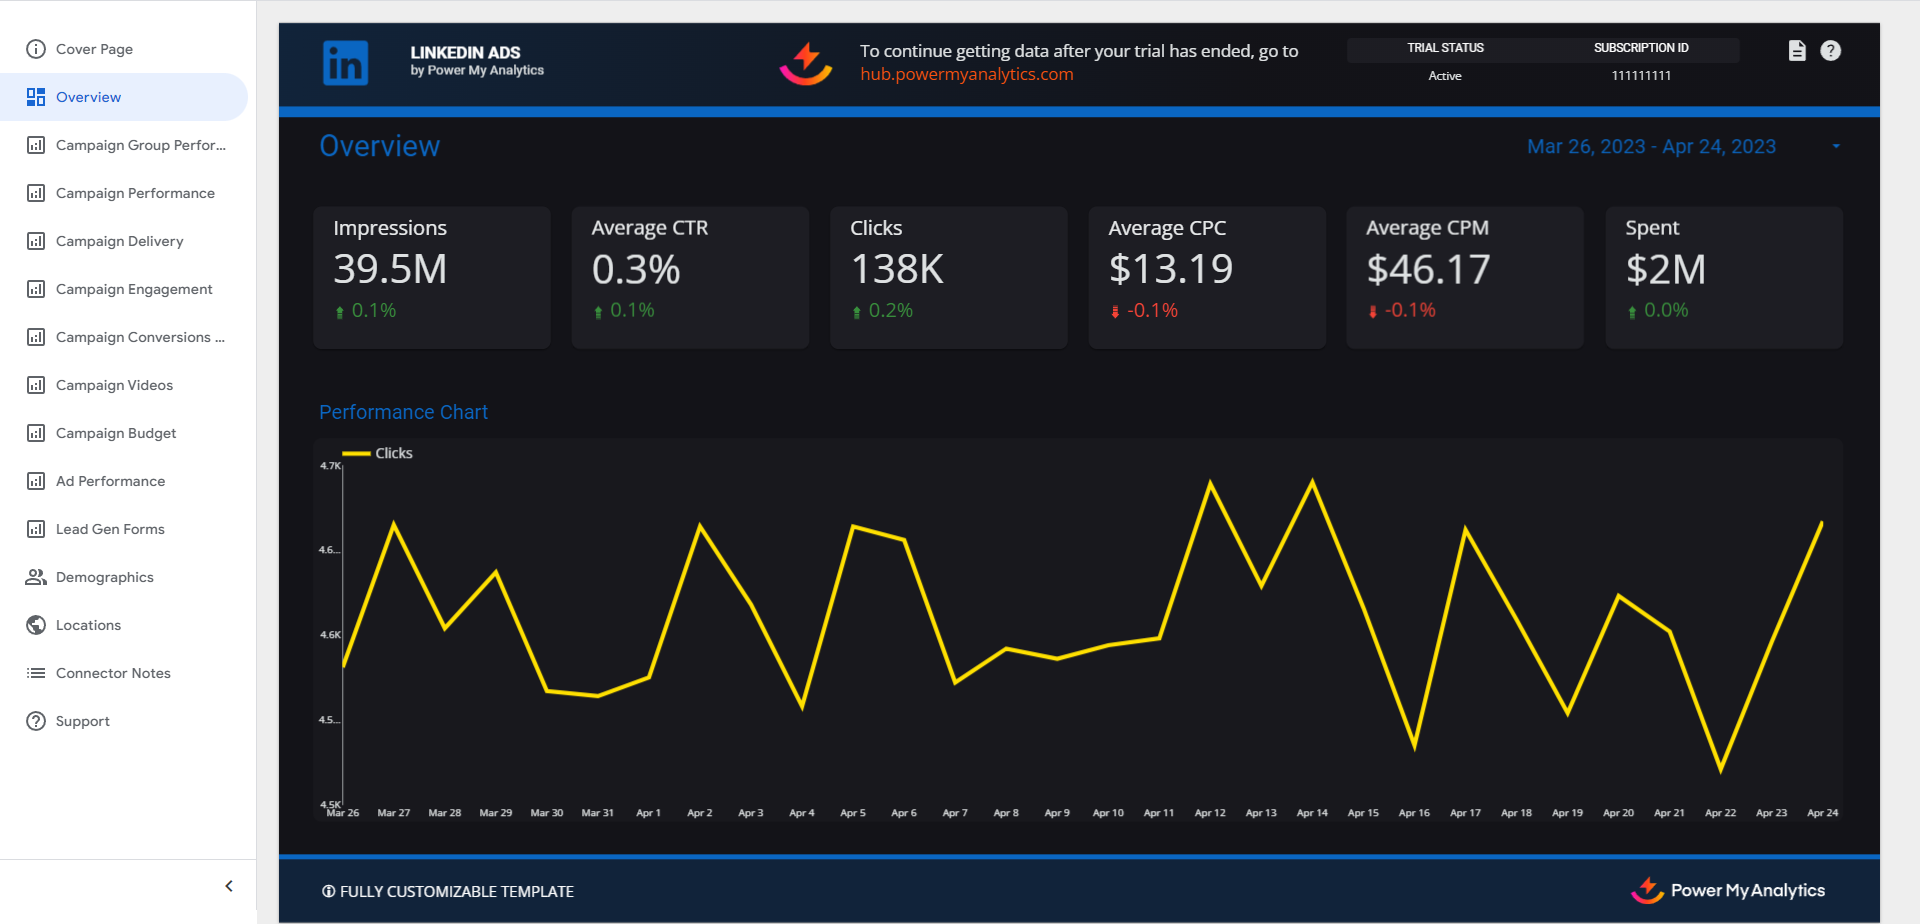
For a quick start, use our pre-built LinkedIn Ads demo template.
LinkedIn's 2025 Campaign Naming Change
Heads up: Starting in October 2025, LinkedIn Campaign Manager renamed two levels of its ad hierarchy. What LinkedIn now calls a Campaign was previously called a Campaign Group, and what it now calls an Ad set was previously called a Campaign. This is a label change in LinkedIn's interface only; it does not change your data or how it syncs to Power My Analytics.
When you compare your Power My Analytics reports to LinkedIn's interface, use this mapping:
|
LinkedIn (before Oct 2025)
|
LinkedIn (Oct 2025 onward)
|
In Power My Analytics
|
|
Ad account
|
Ad account
|
Account
|
|
Campaign group
|
Campaign
|
Campaign Group
|
|
Campaign
|
Ad set
|
Campaign
|
|
Ad
|
Ad
|
Ad
|
Power My Analytics keeps its established field names (Campaign Group and Campaign) because LinkedIn's data API did not change; only the Campaign Manager labels did. So LinkedIn's new "Campaign" maps to Campaign Group in your reports, and LinkedIn's new "Ad set" maps to Campaign. LinkedIn is rolling this change out gradually, so you may still see the previous labels in some accounts.
Key Reports and Fields
LinkedIn Ads data in Power My Analytics offers a wide range of metrics and dimensions, including Revenue Attribution Report metrics formerly available through the LinkedIn Business Manager connector. Here are some popular metrics you can use in your reports:
- Campaign and Campaign Group Metrics: Spent, Impressions, Clicks, Average CTR, Average CPM, Average CPC, Conversions, Cost per Conversion, Leads, Cost Per Lead, Audience Penetration, Event Registrations
- Campaign Delivery Metrics: Spent, Impressions, Reach, Average Frequency, Average CPM
- Campaign Engagement Metrics: Reactions, Comments, Shares, Follows, Other, Clicks to Landing Page, Total Engagement, Engagement Rate
- Conversions and Leads Metrics: Conversions, Click Conversions, View Conversions, Cost per Conversion Total Conversion Value, Leads, Cost Per Lead, Event Registrations
- Video Metrics: Key Results, Cost Per Result, Video Views, Views @ 25%, Views @ 50%, Views @ 75%, Video Completions, Full Screen Plays
- Budget Metrics: Spent, Key Results, Cost Per Result, Total Budget, Daily Budget, Start Date, End Date
- Ad Metrics: Spent, Key Results, Cost Per Result, Impressions, Clicks, Average CTR, Average CPM, Average CPC, Conversions, Cost per Conversion, Leads, Cost Per Lead, Event Registrations
- Lead Gen Metrics: Spent, Lead Form Opens, Cost Per Lead Form Opens, Leads, Cost Per Lead
- Demographic Metrics: Impressions, Clicks, CTR by Member Job Function, Member Job Title, Member Company, Member Industry, Member Seniority, Member Company Size
- Location Metrics: Impressions by Member Country
- Revenue Attribution Report Metrics: Revenue Won, Return On Ad Spend, LinkedIn Ad Spend, Leads, Open Opportunities, Closed Won, Lead Conversion Rate, Opportunity Win Rate, Average Deal Size, Average Days to Close
For a complete list of available LinkedIn Ads fields, refer to the Schema Explorer.
Comparing your LinkedIn Ads numbers to LinkedIn's Analytics screen
LinkedIn's Analytics > Content screen combines organic and sponsored activity into a single figure. Your LinkedIn Ads data covers the sponsored (paid) half of that number, and the organic half comes from the LinkedIn Companies connector:
- LinkedIn Ads carries your sponsored data: campaign impressions, reactions, clicks, and spend.
- LinkedIn Companies carries your organic data: page posts, impressions, reactions, comments, reposts, clicks, visitor analytics, and follower analytics.
To reproduce LinkedIn's combined figure, connect both data sources and add them together in a Data Builder data table or a Data Studio blend. A boosted post's impressions are not counted in both connectors, so summing them will not overstate your totals. For the full walkthrough, see Why is my impressions number lower than LinkedIn's? in the LinkedIn Companies Data Connector User Guide.
Followers are a special case. The LinkedIn Ads Follows metric counts follow actions attributed to your ad engagement. It is not the same thing as the Sponsored followers field in the LinkedIn Companies connector, so do not add the two together. For follower reporting, use the Organic followers and Sponsored followers fields in LinkedIn Companies.
Limitations and Important Considerations
- Cached Data Requests with Unique Metrics and Date Dimension: When a unique metric is paired with the date dimension, this will result in a request for cached data instead of a request for live data. For more information, please see Understanding Cached and Live Data Requests.
-
Backfilling: An initial backfill of 24 months of data will be performed when you first connect your LinkedIn Ads account as a data source.
- Conversions by Conversion Name: Conversions by conversion name are not available at the campaign level or ad level
- Demographic Data Delay: Demographic data is delayed by up to 48 hours
- Paused Campaigns: Demographic data cannot be obtained for paused campaigns
- Rate Limit: Charts with over 15,000 rows may load slowly or produce an error due to exceeding the API's rate limit
- Reach and Average Frequency Date Range: Reach and Average Frequency reporting is limited by LinkedIn’s API to 92 days. Reports with a date range of over 92 days will return an incorrect value of 0 for these fields.
- Reach: The Reach field is under development by LinkedIn and may not match UI values exactly
- Reporting Audience Penetration: The Audience Penetration metric cannot be reported with a date range of longer than 92 days. This field is only available in the Campaign report.
- Six-Month Limitation on Daily Data Granularity: For time frames longer than 6 months, daily data is not retained. The entire month of data will be reported for each month beyond 6 months.
- Revenue Attribution Reporting Date Range Requirements: RAR metrics require a date range between 30 and 366 days
- Live RAR Data Only: RAR metrics provide live data only, not cached data
- Revenue Attribution Daily Granularity: Daily breakdowns for RAR metrics are not available, only all-time data
- RAR Data Noise: LinkedIn's API injects a small amount of "noise" into RAR data to protect customer privacy. Over longer date ranges, more noise will be added to the data.
Unavailable Data
- Event registrations
- Thumbnails for videos and carousel posts
- Reporting on personal pages
- Pipeline Amount
- Custom fields
Demographic Reporting Limitations
Demographic reports have several limitations to protect user privacy:
- Age and device type demographics are not reported
- Demographic values with fewer than 3 events are not reported
- Demographics cannot be reported with carousel metrics
- Only the top 100 demographic values for each creative will be reported for each day
- The following metrics cannot be combined with demographic dimensions: Card Clicks, Card Impressions, Viral Card Clicks, and Viral Card Impressions
For more information, see our article LinkedIn Ads and LinkedIn Companies Grand Total Displayed Does Not Match the Sum of the Values in Some Charts.
Troubleshooting
- Troubleshooting LinkedIn Connectors
- LinkedIn Companies Data Connector User Guide – includes "Why is my impressions number lower than LinkedIn's?", the full organic and sponsored reconciliation walkthrough
- Basic Troubleshooting
Related Articles
LinkedIn Companies Data Connector User Guide
LinkedIn Companies is a powerful data source that provides valuable insights into your company's LinkedIn page performance. This guide will walk you through the process of setting up and using the LinkedIn Companies data source in Power My Analytics, ...LinkedIn Business Manager July 30, 2025 Migration to LinkedIn Ads
This guide will help you migrate your Revenue Attribution Report (RAR) data access from the LinkedIn Business Manager connector to the LinkedIn Ads connector. This migration is required to maintain access to your RAR data after July 30, 2025. ...Troubleshooting LinkedIn Connectors
Power My Analytics offers two LinkedIn data connectors, LinkedIn Ads and LinkedIn Companies, for reporting on your advertising performance, company page analytics, and revenue attribution data. This article is a central index of troubleshooting ...Understanding Data Delays
Some data sources report data with a built-in delay imposed by their platform APIs. This article explains which Power My Analytics connectors are affected, how long each delay lasts, and what it means for your reports. What Is a Data Delay? A data ...How to Connect to LinkedIn Ads
Looking to bring your LinkedIn Ads data into a single, automated reporting workflow? This guide will walk you through connecting LinkedIn Ads as a data source in Power My Analytics, so you can centralize your B2B advertising metrics, create ...