Shopify Data Connector User Guide

This guide will walk you through the process of setting up and using Shopify as a data source in Power My Analytics. By connecting your Shopify store, you'll be able to automate data collection, centralize your e-commerce metrics, and easily create customized reports. This guide covers prerequisites, adding Shopify as a data source, creating a Data Studio report, key reports and fields, and important considerations.
Prerequisites
Before you begin, ensure you have:
- Store owner access or staff access with all permissions to set up the connection
Grant Permissions to a User in Shopify
- Add a staff member: In your Shopify settings, go to Users and permissions. Under Add staff, enter the first name, last name, and email address of the staff member.
- Make sure staff members who need access are given all permissions by clicking Select all.
Adding Shopify as a Data Source
- Navigate to your PMA Hub and select Sources from the menu.
- Click + Add new source and choose Shopify from the gallery.
- Install the Power My Analytics app from the Shopify app store.
For more information on adding Shopify as a data source, please see How to Connect to Shopify.
Creating a Data Studio Report
Follow these steps to create a Data Studio report using your Shopify data:
- After adding Shopify as a data source in the PMA hub, navigate to Reports > Data Studio
- Select Shopify under Create Data Studio Report (this will open the official Data Studio application in a new window)
- Google Data Studio Configuration:
- Step 1:
- Name your data source (e.g., "Shopify - Organization Name")
- Choose your Power My Analytics hub from the dropdown
- Optional: Leave "Use report template for new reports" checked to use the PMA demo template
- Click Next
- Step 2:
- User Account: Select your Shopify account (for real data) or "Sample Account" (for sample data)
- Click Next
- Step 3:
- Choose "Clients" for reports
- Optional: Allow "Clients" modification in reports
- Click Connect (top right) to complete the data source configuration
- Step 4:
- Click Create Report (top right)
For a quick start, use our pre-built Shopify demo template.
Key Reports and Fields
Shopify data in Power My Analytics offers a wide range of metrics and dimensions. Here are some popular metrics you can use in your reports:
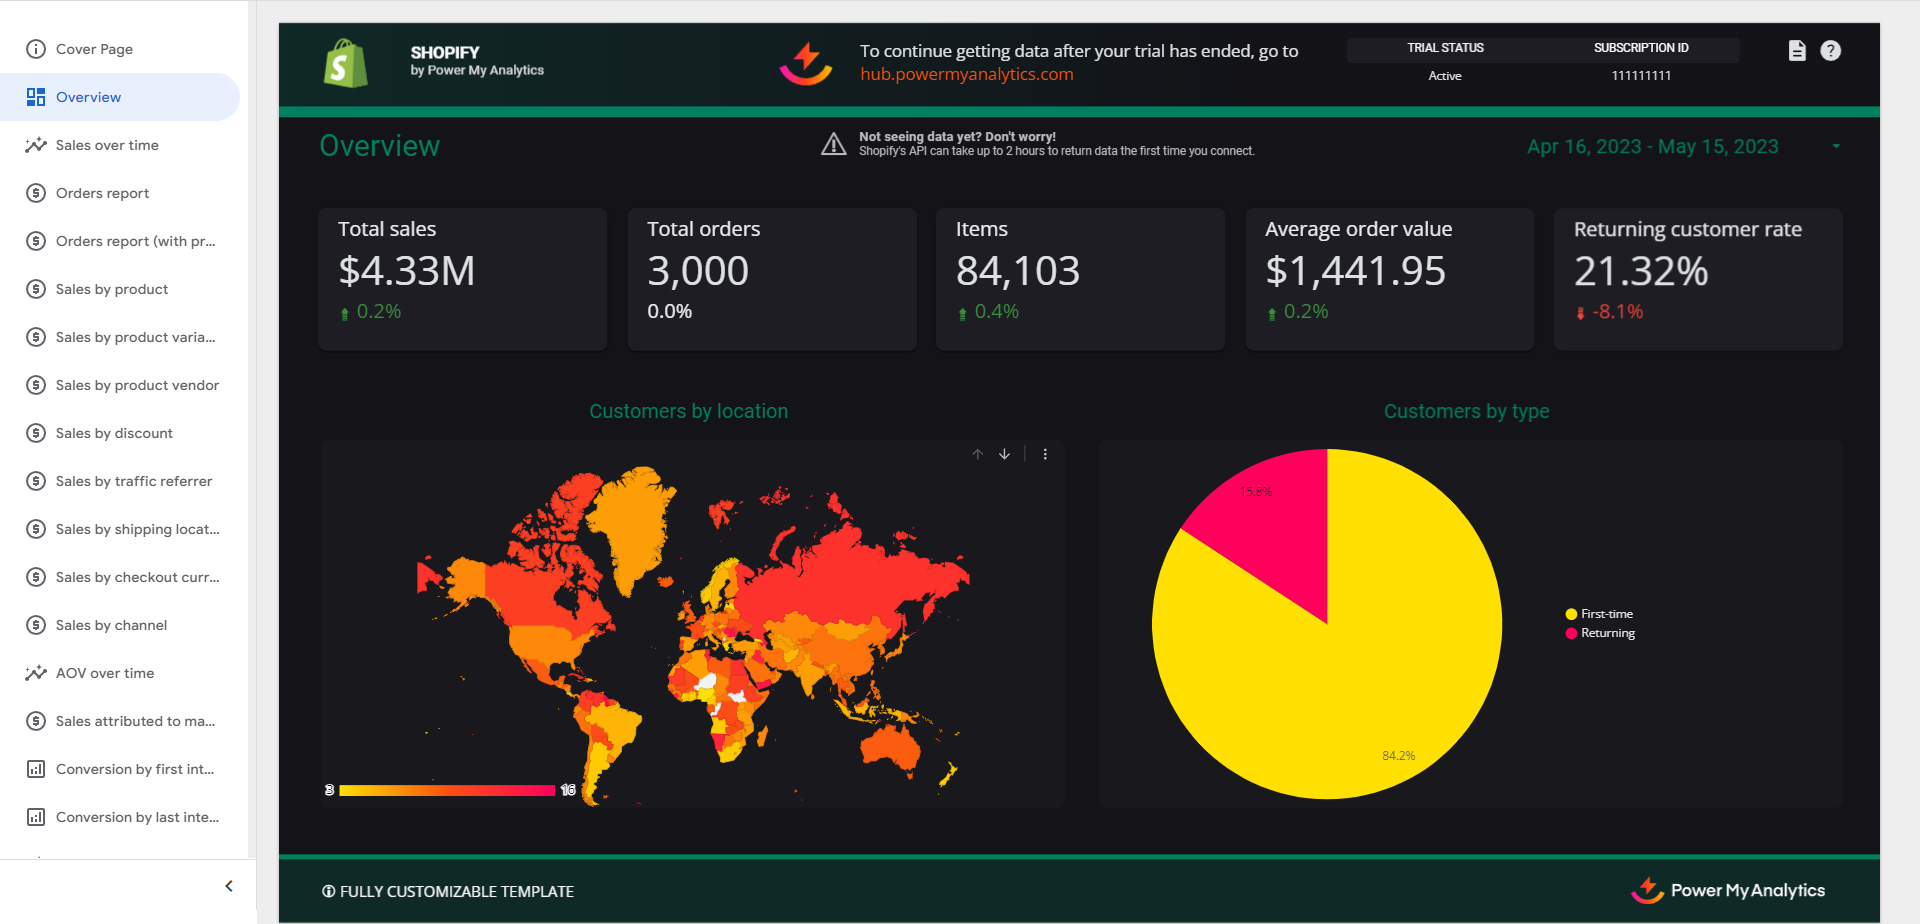
- Performance Metrics: Total sales, Total orders, Items, Average order value, Returning customer rate, Customers
- Sales Metrics: Total sales, Orders, Gross sales, Discounts, Returns, Net sales, Shipping, Tax, Total sales, Item Quantity, Total Sales (Line Items)
- Order Metrics: Items, Gross sales, Discounts, Returns, Net sales, Tax, Shipping, Order total, Item quantity, Total Sales (Line Items), COGS (calculated), Gross profit (calculated), Gross margin (calculated)
- Conversion Metrics: AOV, Orders, Total sales
- Customer Metrics: Orders, Average order value, Total sales by Customer type
- Inventory Metrics: Inventory by Location, Variants, Inventory by Product title, Product type, Product vendor, Product status
- Return Metrics: Returns, Total sales
- First Session UTM Metrics: UTM Campaign, UTM Source, UTM Medium, UTM Content
- Order UTM Metrics: Order UTM campaign, Order UTM content, Order UTM source, Order UTM medium, Order UTM term
For a complete list of available Shopify fields in Power My Analytics, refer to the Schema Explorer.
Reporting COGS, Gross Profit, and Gross Margin
The fields COGS, Gross Profit, and Gross Margin are based on the following values:
- COGS (Cost of goods sold): Cost per item * quantity
- Gross profit: Net Sales (Line Items) - COGS
- Gross margin: Gross profit / Net Sales (Line Items)
Limitations and Important Considerations
- Cached Data Requests with Unique Metrics and Date Dimension: When a unique metric is paired with the date dimension, this will result in a request for cached data instead of a request for live data. For more information, please see Understanding Cached and Live Data Requests.
- Backfilling: An initial backfill of 24 months of data will be performed when you first connect your Shopify account as a data source.
- Data delay: Data may take 2 hours to appear after first connecting your Shopify account. Wait 2 hours after connecting to see all of your data.
- API data differences: Because there are slight variations between how Shopify’s UI records data and how Shopify’s API records data, you may see a difference in reported data of approximately 2%.
- Inventory reporting (current value only): Shopify’s API provides only the current inventory value, not historical inventory. Power My Analytics shows the latest available inventory, so your inventory figures always reflect the most recent data regardless of the date range selected. Historical inventory levels, inventory over time, and inventory adjustment history (for example, isolating manual stock movements) are not available.
- VAT reporting discrepancy: The fields Gross Sales, Discounts, and Total Sales may differ from Shopify values by less than 1% when VAT is collected. This is due to limitations in the data provided by Shopify. We are currently awaiting a fix from Shopify for this issue.
- Sales Channel App Names: Shopify's API does not report all sales channel apps by name. When sales are placed using apps which the API does not report by name, these sales will appear under "Draft Orders".
- Missing POS Location Name data: Metrics using POS Location Name as a dimension will report "0" values if the read_locations (View store data) permission scope is not enabled when connecting Power My Analytics to your Shopify account. To obtain POS Location Name data, you will need to disconnect and reconnect your Shopify data source with the required permissions, and backfill your data over the necessary date range. For more information, please see Missing POS Location Name Data in Shopify.
Unavailable Data
- Inventory history: historical inventory levels, inventory over time, and inventory adjustment history are not available. Shopify’s API provides only the current inventory value, so inventory cannot be reported by date or as a trend.
- Conversion funnel: Shopify’s API does not currently provide the fields necessary for a conversion funnel (Total Sessions, Added to Cart, Reached Checkout, Sessions Converted, Sessions over time, Session by location, Session by device, Conversion over time)
- Campaigns report data
- Brands
- Live fields
- Realtime data
- Custom fields
- Metafields (meta fields)
Get the Most Out of Your Shopify Reports
Blend with Google Analytics to get conversion funnel reports
Apply Google Analytics trackers to your store. You can import that data with our Google Analytics connector and use Data Studio's Blend Data tool to combine them on the same report.
Report Sales by Brand using Google Sheets
Create a Google Sheets spreadsheet with the following information:
- Brand
- Variant SKU
Troubleshooting
See our article Troubleshooting Shopify for information on issues that may affect the Shopify connector.
Related Articles
How to Connect to Shopify
The following article provides the steps for setting up your Shopify store to allow PMA's connector to collect data. Prerequisites Before you begin, ensure you have: Store owner access or staff access with all permissions to set up the connection ...Klaviyo Data Connector User Guide
Are you looking to streamline your email and e-commerce marketing data analysis? This guide will walk you through setting up Klaviyo as a data source in Power My Analytics. By integrating Klaviyo with PMA, you'll be able to automate your data ...Understanding Data Delays
Some data sources report data with a built-in delay imposed by their platform APIs. This article explains which Power My Analytics connectors are affected, how long each delay lasts, and what it means for your reports. What Is a Data Delay? A data ...Mailchimp Data Connector User Guide
Are you looking to streamline your email marketing analytics and reporting? Power My Analytics' Mailchimp integration allows you to easily connect your Mailchimp account, automate data collection, and create powerful reports. This guide will walk you ...Missing POS Location Name Data in Shopify
If you're seeing blank or missing data or "0" values for metrics when using the POS Location Name dimension in your Shopify reports, this article will help you resolve the issue. This problem occurs when your Shopify connection doesn't have the ...