ShareASale Data Connector User Guide

This guide will walk you through the process of integrating ShareASale with Power My Analytics, enabling you to automate your data collection and create powerful reports. By following these steps, you'll be able to effortlessly track key metrics, analyze your affiliate program's success, and make data-driven decisions to optimize your marketing efforts.
Prerequisites
Before you begin, ensure you have the following:
- An active ShareASale merchant account
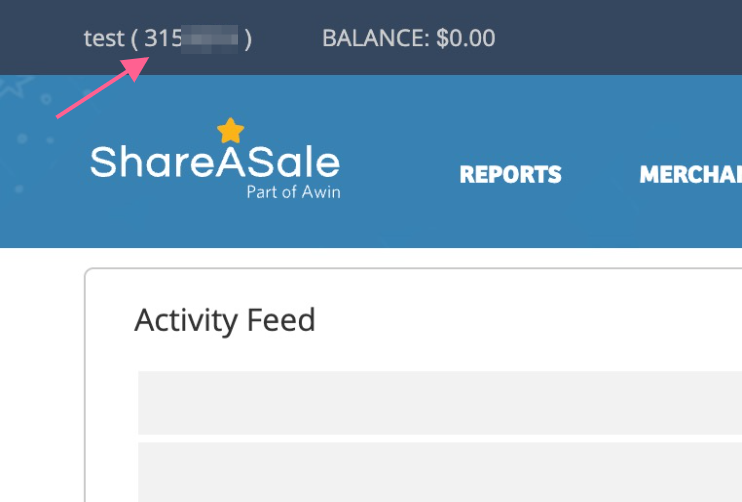
- Your ShareASale Token, API Secret (on the Merchant API page), and Merchant ID (in the upper left corner of your ShareASale account)
- ShareASale Merchant API settings set to "Require IP address match only for version 1.1 and lower"
Adding ShareASale as a Data Source
- Go to your PMA hub and navigate to Sources from the menu.
- Click + New Data Source.
- Choose ShareASale from the gallery.
- Enter your Token, API Secret, and Merchant ID for your ShareASale account.
- Provide a name for your ShareASale account.
- Click Connect.
Creating a Data Studio Report
Follow these steps to create a Data Studio report using your ShareASale data:
- After adding ShareASale as a data source, go to Reports > Data Studio
- Select ShareASale under Create Data Studio Report (this will open the official Data Studio application in a new window)
- Google Data Studio Configuration:
- Step 1:
- Name your data source (e.g., "ShareASale - Your Organization Name")
- Choose your Power My Analytics hub from the dropdown
- Optional: Leave "Use report template for new reports" checked for the PMA demo template
- Click Next
- Step 2:
- User Account: Select your ShareASale account (for real data) or "Sample Account" (for sample data)
- Click Next
- Step 3:
- Click Connect (top right) to complete the data source configuration
- Step 4:
- Click Create Report (top right)
For a quick start, use our pre-built ShareASale demo template.
Key Reports and Fields
ShareASale offers a wide range of metrics and dimensions for comprehensive reporting. Some popular metrics include:
- Key Performance Metrics: Transactions, Net Sales, Clicks, Commissions, Active Affiliates
- Transaction Metrics: Transaction Amount, Return Days, Commission, ShareASale Fees; by Date And Time, Transaction ID, Commission Type, Comment, Transaction Type
- Banner Reporting Metrics: Transaction Amount, Return Days, Commission, ShareASale Fees; by Banner Name, Banner Type, Banner Number, User ID
- Affiliate Reporting Metrics: Affiliates, Active Affiliates, Avg Return Days, Account Balance, Number of Bonuses, Transaction Amount, Return Days, Commission, ShareASale Fees
- Affiliate Sales Metrics: Affiliates, Active Affiliates, Gross Sales, Commissions, Clicks, Net Sales, Sales Commissions
For a complete list of available fields, refer to the Schema Explorer.
Limitations and Important Considerations
- Cached Data Requests with Unique Metrics and Date Dimension: When a unique metric is paired with the date dimension, this will result in a request for cached data instead of a request for live data. For more information, please see Understanding Cached and Live Data Requests.
- Backfilling: An initial backfill of 24 months will be performed when you first connect your ShareASale account as a data source.
- Request limit: ShareASale's API allows 200 reports per account per month. Power My Analytics generates around 90 reports per month, with backfills generating about 3 reports.
- Affiliate Reporting: Be cautious when using Affiliates and Active Affiliates fields, as they have different versions for daily charts and scorecards. Using the wrong type in a report can lead to inflated values.
Unavailable Data
- Custom fields
Understanding Affiliate Reporting
There are two types of fields for Affiliates and Active Affiliates. They are labeled (use in a daily chart) and (use in a scorecard). If a field that is labeled (use in a scorecard) is used in a daily chart, or vice versa, the numbers will be inflated. Use caution when choosing the appropriate field for your chart.
Troubleshooting
See our article Basic Troubleshooting for information on issues that may affect the ShareASale connector.
Related Articles
How to Connect to ShareASale
Looking to bring your ShareASale affiliate marketing data into a single, automated reporting workflow? This guide will walk you through connecting ShareASale as a data source in Power My Analytics, so you can centralize your transaction, commission, ...Mailchimp Data Connector User Guide
Are you looking to streamline your email marketing analytics and reporting? Power My Analytics' Mailchimp integration allows you to easily connect your Mailchimp account, automate data collection, and create powerful reports. This guide will walk you ...PayPal Data Connector User Guide
PayPal is a widely used payment processing platform, and integrating its data into your analytics workflow can provide valuable insights into your business performance. This guide will walk you through the process of setting up PayPal as a data ...Stripe Data Connector User Guide
Stripe is a powerful payment processing platform that enables businesses to accept online payments, manage subscriptions, and handle invoicing. This guide will walk you through the process of connecting Stripe to Power My Analytics, creating reports, ...BigCommerce Data Connector User Guide
Are you looking to streamline your BigCommerce data analysis and reporting? Power My Analytics' BigCommerce connector automates the collection and integration of your e-commerce data, saving you time and providing deeper insights into your online ...