X Ads (Twitter) Data Connector User Guide

X Ads (formerly Twitter Ads) is a powerful advertising platform that allows marketers to reach their target audience on one of the world's most popular social media networks. This guide will walk you through the process of connecting your X Ads account to Power My Analytics, creating reports, and understanding key metrics and considerations.
Prerequisites
- An active X account with Ad Manager access to the ad account you want to connect
- Your X account must have an active X Premium subscription (blue checkmark)
Granting Access to a User in X Ads
To grant Ad Manager access to a user:
- Go to X Ads and open the menu under your name.
- Click Edit access to account.
- Click the Add access button.
- Enter the user's name and select Ad manager access.
- Click Save changes.
Adding X Ads as a Data Source
- Log in to your Power My Analytics account.
- Navigate to your Hub and select Sources from the menu.
- Click the + Add new source button.
- Choose X Ads from the gallery of available data sources.
- Sign in to your X account when prompted to authenticate.
Creating a Data Studio Report
Follow these steps to create a Data Studio report using your X Ads data:
- After adding X Ads as a data source in the PMA hub, go to Reports > Data Studio
- Select X Ads under Create Data Studio Report (this will open the official Data Studio application in a new window)
- Google Data Studio Configuration:
- Step 1:
- Name your data source (e.g., "X Ads - Your Organization Name")
- Choose your Power My Analytics hub from the dropdown
- Optional: Leave "Use report template for new reports" checked to use the PMA demo template
- Click Next
- Step 2:
- User Account: Select your X Ads account (for real data) or "Sample Account" (for sample data)
- Click Next
- Step 3:
- Choose "Accounts" and "Currency" for your reports
- Optional: Allow "Accounts" modification in reports
- Click Connect in the top right to complete the data source configuration
- Step 4:
- Click Create Report in the top right
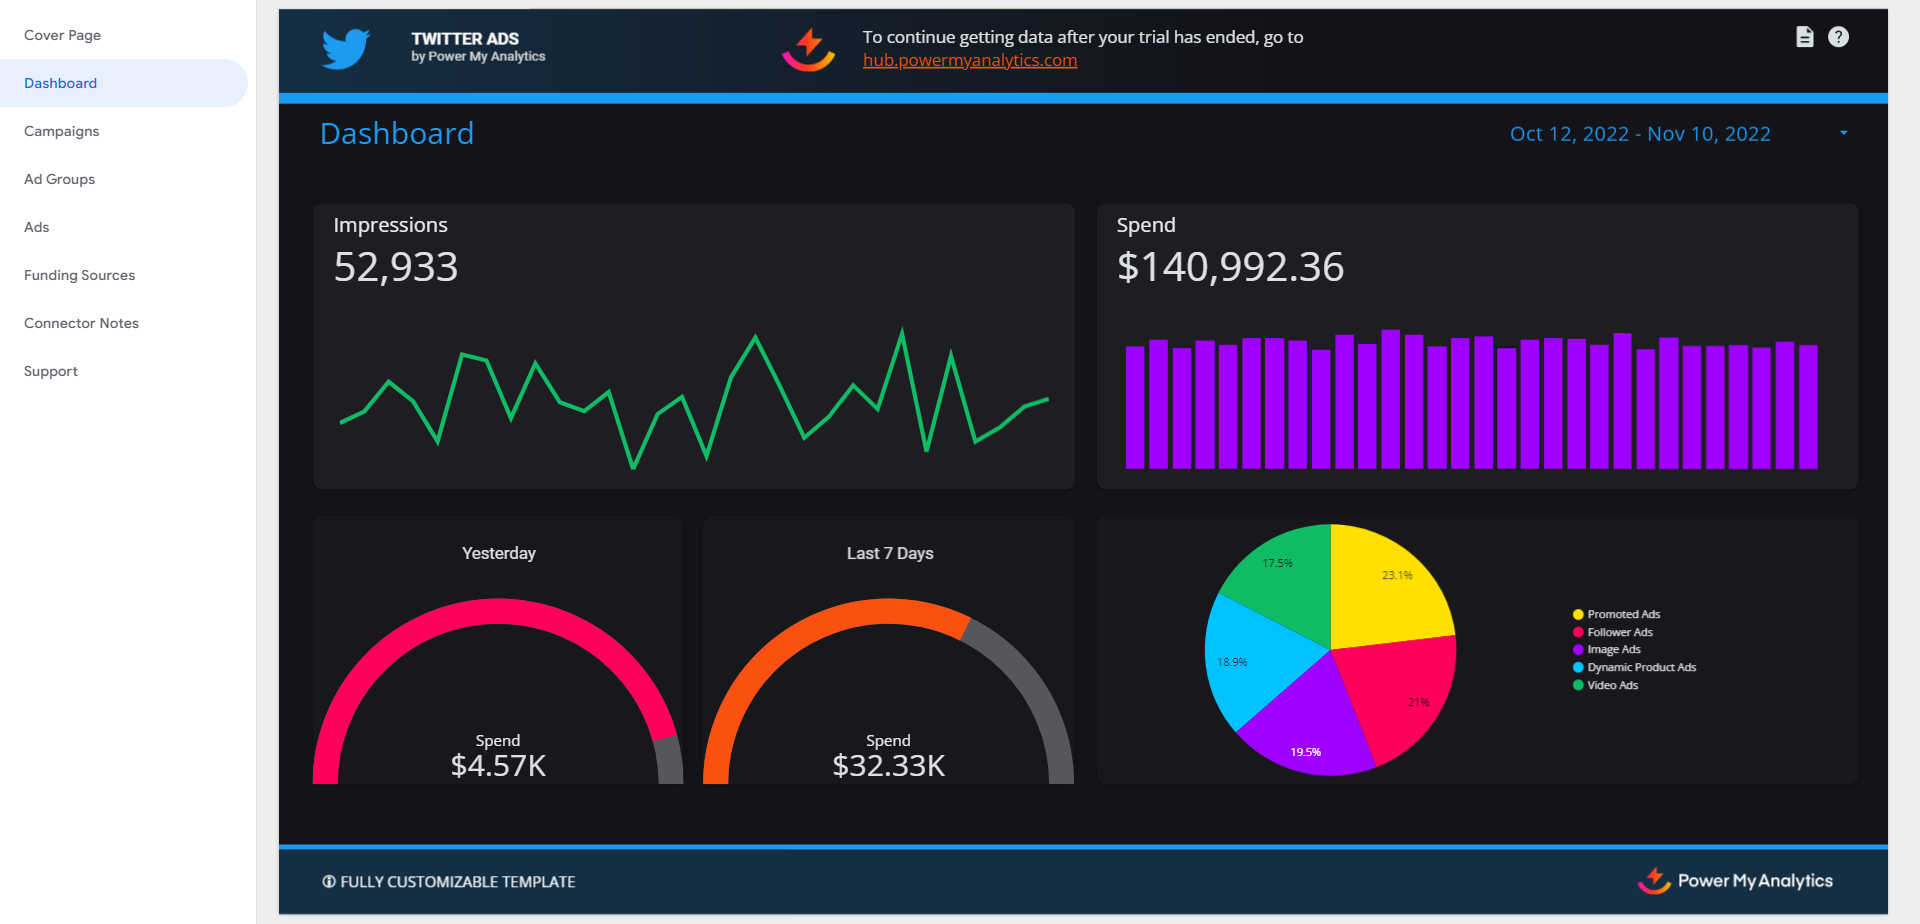
For a quick start, use our pre-built X Ads demo template.
Key Reports and Fields
X Ads data in Power My Analytics offers a wide range of metrics and dimensions for your reports. Some popular metrics include:
- Key Performance Metrics: Impressions over time, clicks, engagements, follows, spend
- Analytics by Campaign: Impressions, spend, clicks by campaign, daily budget, total budget, custom conversions
- Analytics by Ad Group: Impressions, spend, clicks by ad group name, objective
- Analytics by Ad: Impressions, spend, clicks by tweet text, tweet link
- Analytics Breakdowns: Breakdowns by language, platforms, countries, gender, age
For a complete list of available X Ads fields, refer to the Schema Explorer.
Limitations and Important Considerations
- Cached Data Requests with Unique Metrics and Date Dimension: When a unique metric is paired with the date dimension, this will result in a request for cached data instead of a request for live data. For more information, please see Understanding Cached and Live Data Requests.
- Backfilling: An initial backfill of 24 months of data will be performed when you first connect your X Ads account as a data source.
- Region-level geo breakdown (deprecated): X permanently discontinued region-level ad segmentation in mid-2026, so region breakdowns are no longer available (this is a change on X's end). Country-level geo reporting is unaffected and remains available.
Unavailable Data
- Custom fields
Troubleshooting
See our article Basic Troubleshooting for information on issues that may affect the X Ads connector.
Related Articles
X Analytics (Twitter) Data Connector User Guide
X Analytics (formerly Twitter Analytics) is a powerful data source that provides valuable insights into your X account's performance, audience engagement, and tweet activity. This guide will walk you through the process of setting up X Analytics as a ...Amazon Ads Data Connector User Guide
Amazon Ads is a powerful advertising platform that allows sellers and brands to promote their products on Amazon. This guide will walk you through how to connect Amazon Ads to Power My Analytics, create reports in Looker Studio, and understand key ...Quora Ads Data Connector User Guide
Quora Ads allows marketers to reach a highly engaged audience through targeted advertising on the Quora platform. This guide will walk you through how to connect your Quora Ads data to Power My Analytics and create insightful reports in Data Studio. ...LinkedIn Ads Data Connector User Guide
LinkedIn Ads is a powerful platform for B2B marketing, lead generation, brand awareness campaigns, and revenue attribution. This guide will help you connect your LinkedIn Ads account to Power My Analytics, enabling you to create comprehensive reports ...Google Ads Data Connector User Guide
Google Ads is a powerful online advertising platform that allows businesses to reach potential customers across Google's vast network. This guide will walk you through how to connect your Google Ads data to Power My Analytics, create reports in Data ...